Enquiry Now

 Contact Us


 Check Out
 +44 20 4571 2395

 PRINCE2® Foundation and Practitioner Training


 Aaron Charlie
 7 Oct 2011
Google Analytics Real Time Reporting - First Look
Changes are afoot in Google Analytics! Last week I wrote up a guide on how to make the most of the new SEO Queries Report - which brings in data on number of impressions, average position and clickthrough rate from Webmaster Tools.
Now we've managed to get our grubby mitts on to the Beta version of Google Analytics' new Real Time Data offering.
First impressions? It's impressive - it made me feel a lot like Big Brother looking at individual clicks, as they happened, with a map of the world below the results pinging red dots at me as visits from across the globe came in.
But - aside from making you feel like the omnipresent dictator of a fictional totalitarian regime - what benefits can using Google Analytics Real Time data bring?

As soon as it's released fully - we'll be including Real Time in our Google Analytics and Advanced Google Analytics courses!
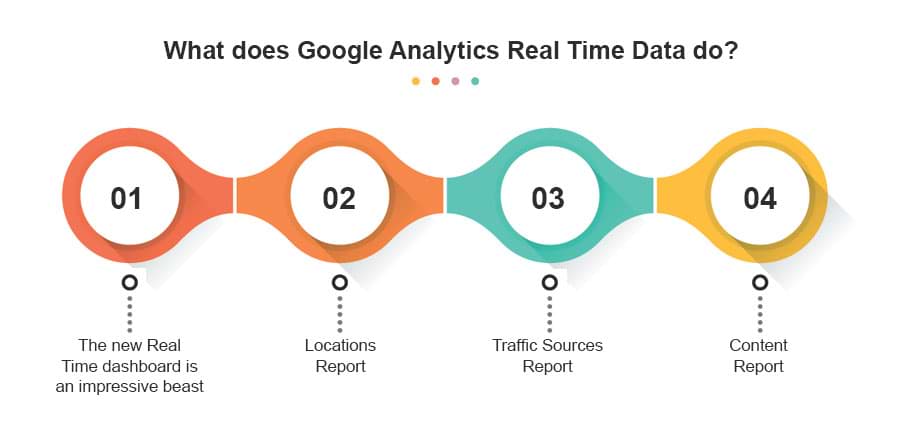
What does Google Analytics Real Time Data do?
Up until now, the default report view in Google Analytics has been the last month's data, ending at midnight the previous day - so very much about looking at your performance retrospectively to inform future site design improvements and SEO activity. You can change the Date Range to include the current day, but it is not up to the minute (general opinion among SEOs is that the data is anything between an hour to four hours behind what's actually happening).
Real Time Data allows you to see what visitors are doing as soon as they do it. On tests we've done, a click in our office down the road showed up within a couple of seconds.
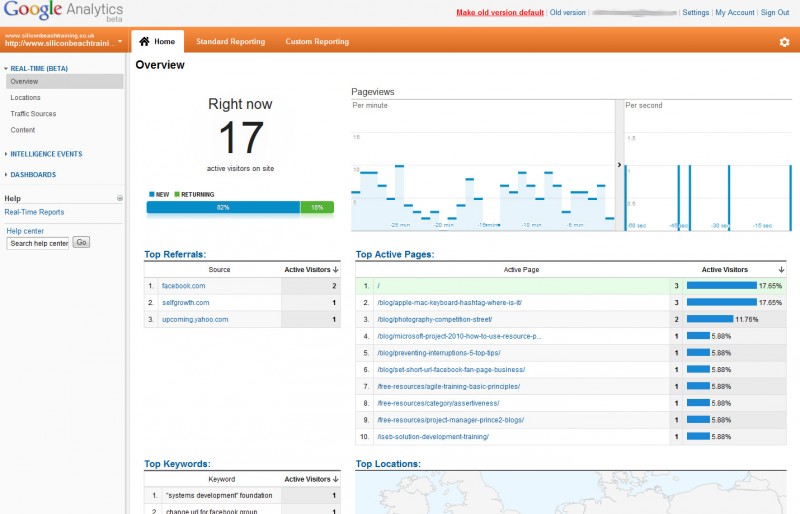
The new Real Time dashboard is an impressive beast...

Click image for larger version
Immediately you can see how many people are on your site RIGHT NOW, and what proportion of them are new visitors vs returning.
There are two graphs - one showing pageviews per minute (for the last 30 minutes) and the other showing pageviews per second (for the last 60 seconds) - with little blue bars pinging up each time a user visits a new page. This really is the stuff of a Bond villains lair!
You can also see the top referring sites for current active visitors (conjuring up an amusing image of fat, lazy "inactive visitors" slouched in their armchairs whose results are not being tracked!), as well as the top 5 keywords that for visitors who came from search engines, and the top 10 pages currently being viewed. As new referrers, active pages and keywords appear they flash green to make you aware of them:
LOOK! I've been visited
You can also click on the individual active pages to see the Content report (below) to drill down in to how the people looking at them right now came in to your site.
Best of all - you get the aforementioned "Top Locations" map with glowing red circles showing where your visitors are coming from - making you feel like the cold war SEO dictator pushing his keyword tanks about with a little wooden rake:
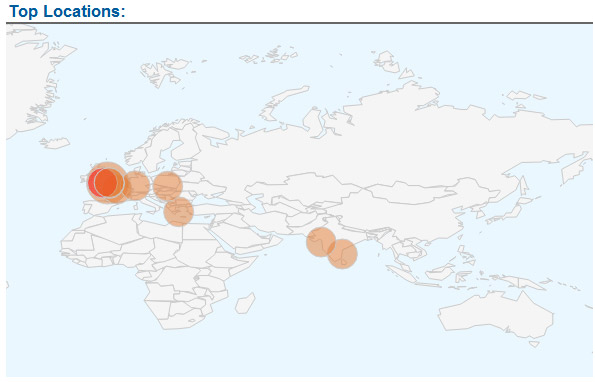
Google Analytics Real Time Data - "No Mr Bond, I expect you to DIE!"
Locations Report
Under the general dashboard in the menu there's a Locations report where you can see visitors by country with the lovely map again, and clicking on the country allows you to drill down to traffic by city, with a smaller map.
Tantilisingly, there was also a "Google Earth" option as well as the map - but despite installing the plugin this wouldn't load - so we'll have to wait before we can have the even greater delights of spinning our virtual globe as hits light up like a Christmas tree!
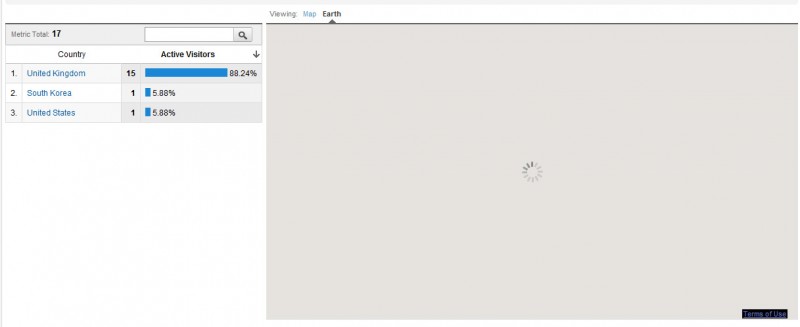
Google Analytics Real Time Locations... Did I break it?! Click for larger image
Traffic Sources Report
The traffic sources report provides details on where all of the current visitors came from and breaks them down in to a useful bar showing Direct, Organic, Referral and Campaign traffic
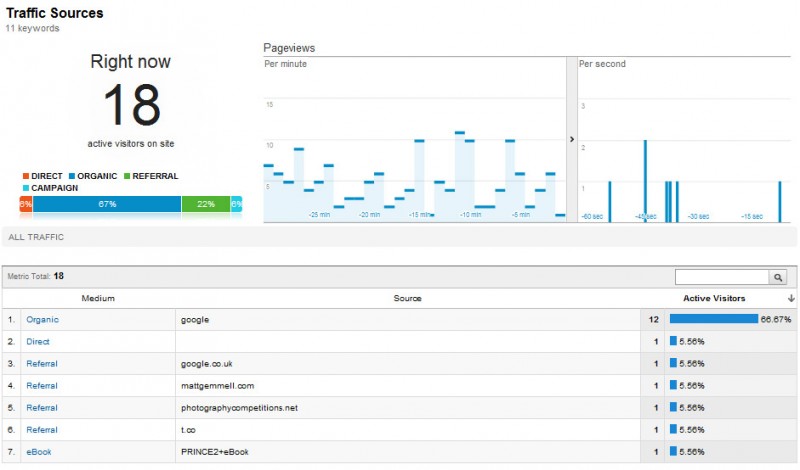
Google Analytics Real Time Traffic Sources - Click for larger image
Clicking on the Organic traffic source will break the results down by keyword, Referrals can be broken down by site, and Direct visits broken down by landing page.
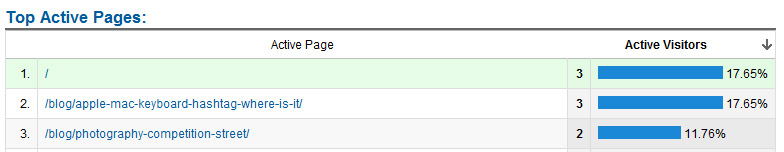
Content Report
The content report shows a list of the top 10 pages being viewed right now, and clicking on each page reveals the traffic sources for each.
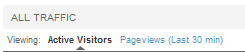
The default view is active users (people on the site right now) - but you can also look at the total results for the last 30 minutes - both overall and by page - which is a nice touch:
It would be even nicer if you could break it down by your own time chunks (i.e. - the last two hours etc...) - but perhaps we'll see that when we get past Beta
Google Analytics Real Time Data Limitations...
OK - we're remembering this is a Beta - but at the moment there are a few limitations...
- At the moment - as we've mentioned above - you can only see data for the last 30 minutes. For anything earlier than that you have to go back to the regular Google Analytics dashboard (which for reliable results, means waiting until tomorrow!)
- There's no profile filtering in Real Time. So if you've set up a profile that filters out the traffic from all of your companies offices, you won't be able to use it at the moment
- You can't apply any advanced filters to the data. One of the things I love about Google Analytics is the ability to analyse data down to the Nth degree with Advanced filters - so if I want to know how many people in Kazakhstan have completed a booking form using an HTC Desire running Android I can find out (the answer by the way, was no-one!) - however with Real Time data - you can't apply any advanced filters at all yet?
- You can't export or save the reports - at the moment, you can look at the data and say "ooh that's interesting" but there's no way of saving a snapshot the results and referring back to them later.
Which brings us on to....
What can you use Google Analytics Real Time for?
As you can probably tell from all my excitable talk of feeling like a Bond villain - I've been quite impressed with Google Analytics Real Time, and being able to see real time hits and user behaviour as it happens certainly has a "wow" factor.
However - most SEOs want numbers. Solid, tangible, reports and spreadsheets full of numbers that they can use their nerdy, data obsessed brains to pore over, analyse, create pivot tables from and use to create marketing plans that can be acted upon.
At the moment, Real Time doesn't provide that. I found that I could sit looking at the data for a period of time with quite a few "ooh that's interesting" moments - but didn't learn much that helped me a great deal.
However - I wasn't looking at the data at a time when there was anything out of the ordinary happening - and when something out of the ordinary happens is the time when Real Time will be of real use.
If you want to track the impact of a Social Media campaign, a mailout to clients or a blog post about a major, time critical-news event - then Real Time data will come in to its own.
You'll be able to track the amount of traffic generated by specific campaigns as they happen -whether they be local or global, watching those little red dots ping up on your globe and wringing your hands together in glee - Mwa-ha-ha-ha-haaaaaaaa!
Posted under:
 Need Any Help?
Recent Blogs