Enquiry Now

 Contact Us


 Check Out
 +44 20 4571 2395

 PRINCE2® Foundation and Practitioner Training


 Andy Trainer
 6 May 2009
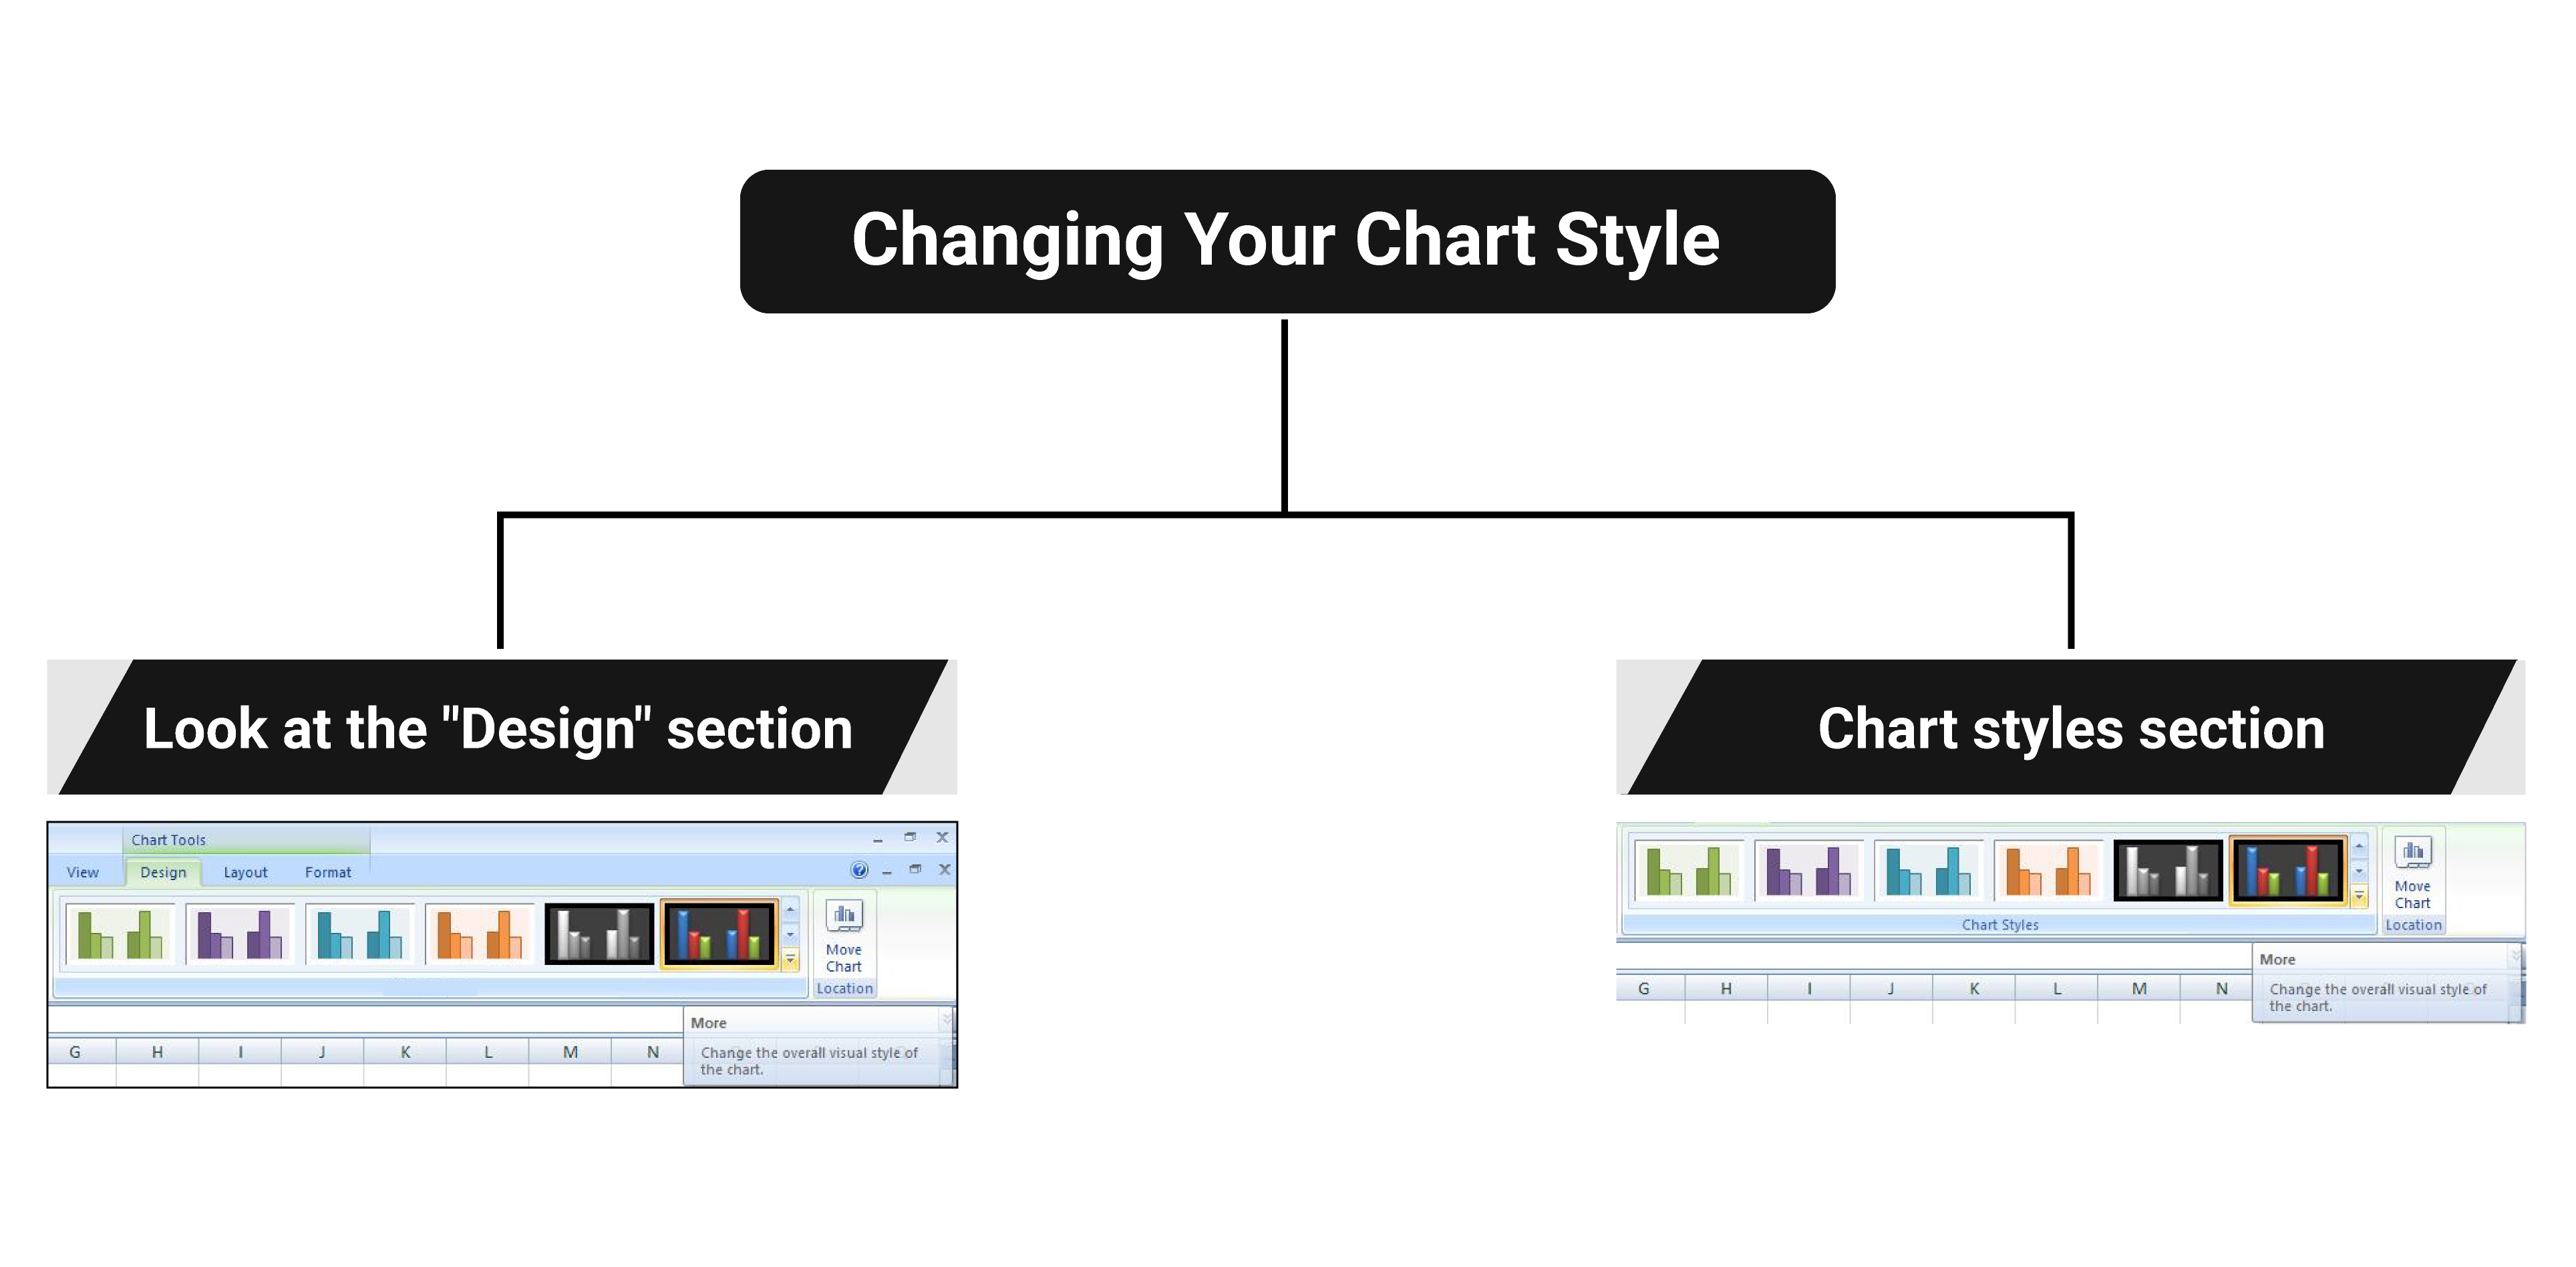
Changing Your Chart Style
Once you're happy with the chart type, you can also change the style so that the colours and fonts fit with the image you want to portray.
Again - select your chart and look at the "design" section of the ribbon. You will find the chart styles section on the right hand side of the ribbon. For more options, click on the “More” arrow as indicated below:

In our example, select layout 42 at the bottom of the list. Excel will then automatically apply this to your chart, like this:

Posted under:
 Need Any Help?
Recent Blogs